Index of /diffusion/analyses/mdb-database/SAO/smos-l3-catds-locean-v9-18d/tsg-csic-utm/figs
Name
Last modified
Size
Description
Parent Directory
-
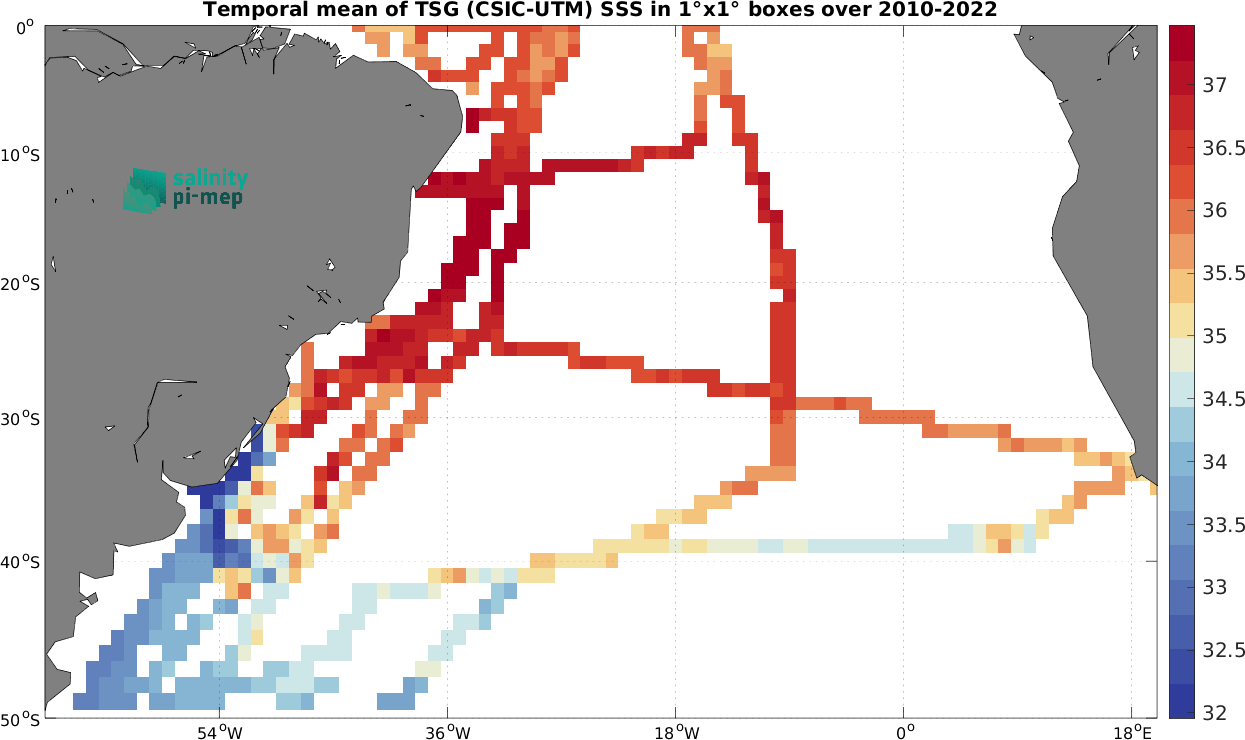
pimep-mdb-figure_SAO_smos-l3-catds-locean-v9-18d_tsg-csic-utm_Time-Mean-SSS-INSITU.png
05-Dec-2024 16:23
71K
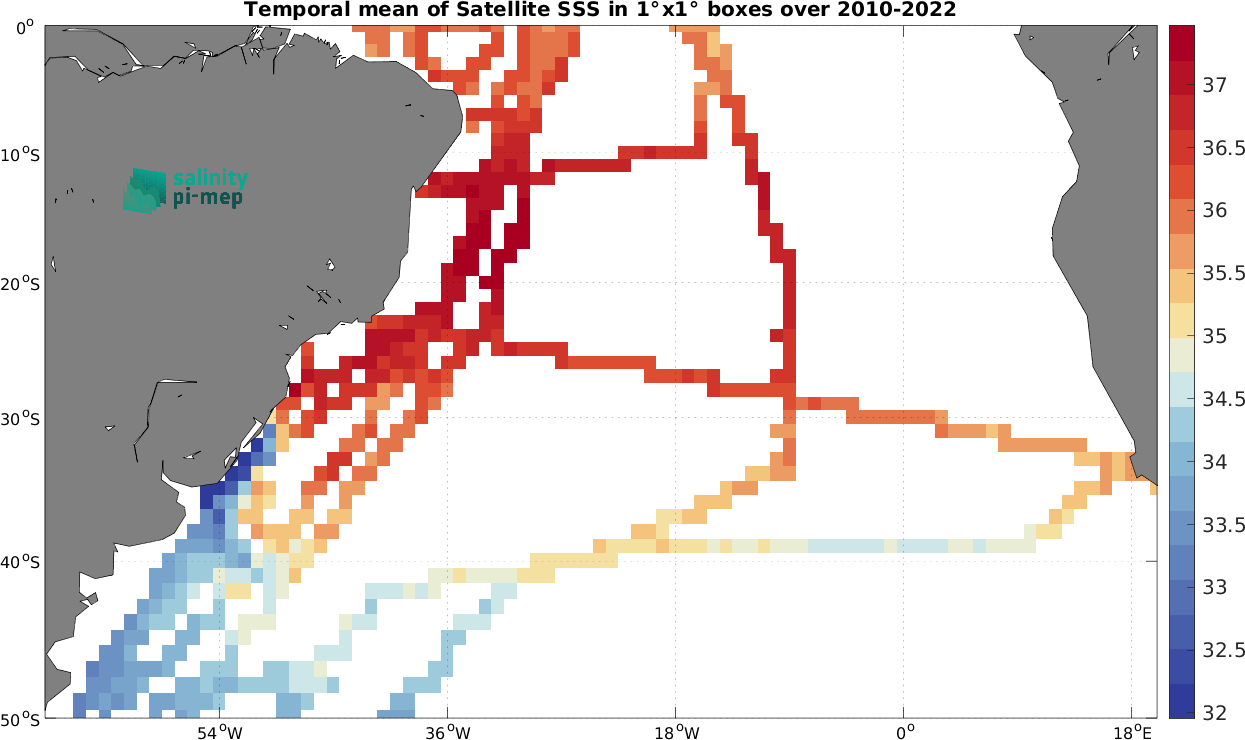
pimep-mdb-figure_SAO_smos-l3-catds-locean-v9-18d_tsg-csic-utm_Time-Mean-SSS-SAT.png
05-Dec-2024 16:23
70K
pimep-mdb-figure_SAO_smos-l3-catds-locean-v9-18d_tsg-csic-utm_Time-Mean-SSS-SAT-minus-INSITU.png
05-Dec-2024 16:23
69K
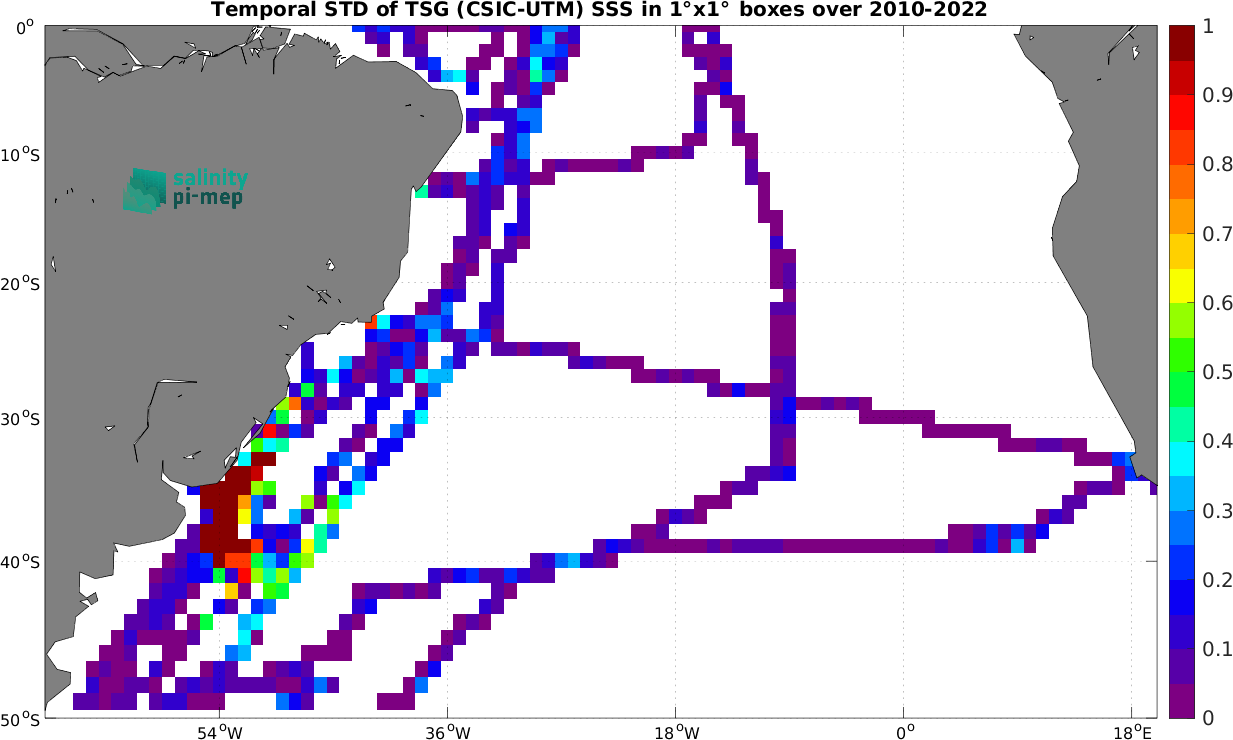
pimep-mdb-figure_SAO_smos-l3-catds-locean-v9-18d_tsg-csic-utm_Time-STD-SSS-INSITU.png
05-Dec-2024 16:23
70K
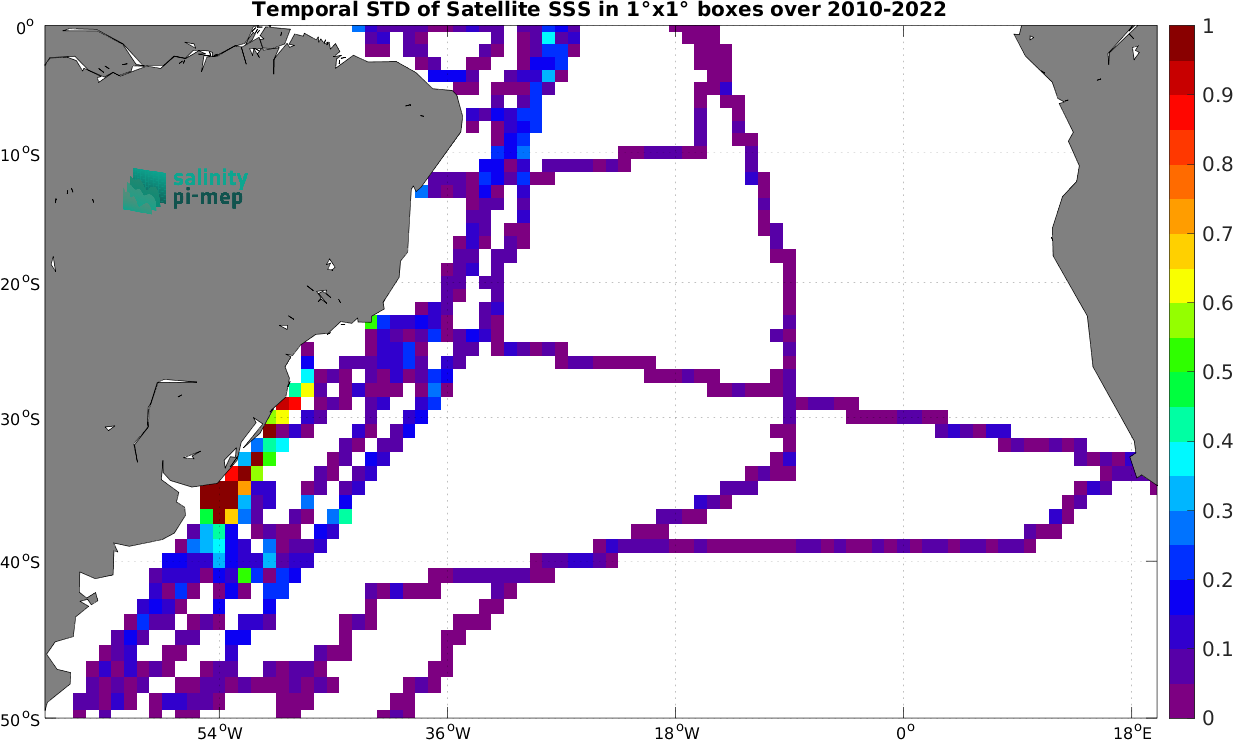
pimep-mdb-figure_SAO_smos-l3-catds-locean-v9-18d_tsg-csic-utm_Time-STD-SSS-SAT.png
05-Dec-2024 16:23
69K
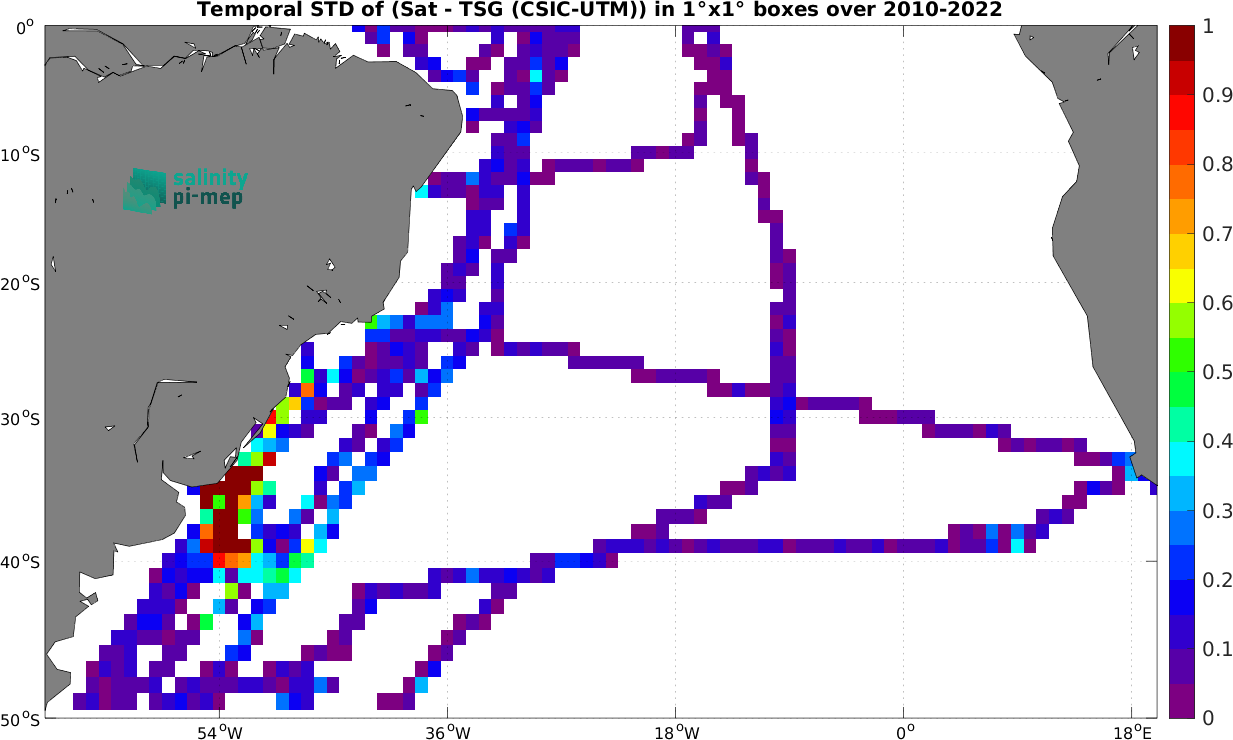
pimep-mdb-figure_SAO_smos-l3-catds-locean-v9-18d_tsg-csic-utm_Time-STD-SSS-SAT-minus-INSITU.png
05-Dec-2024 16:23
70K
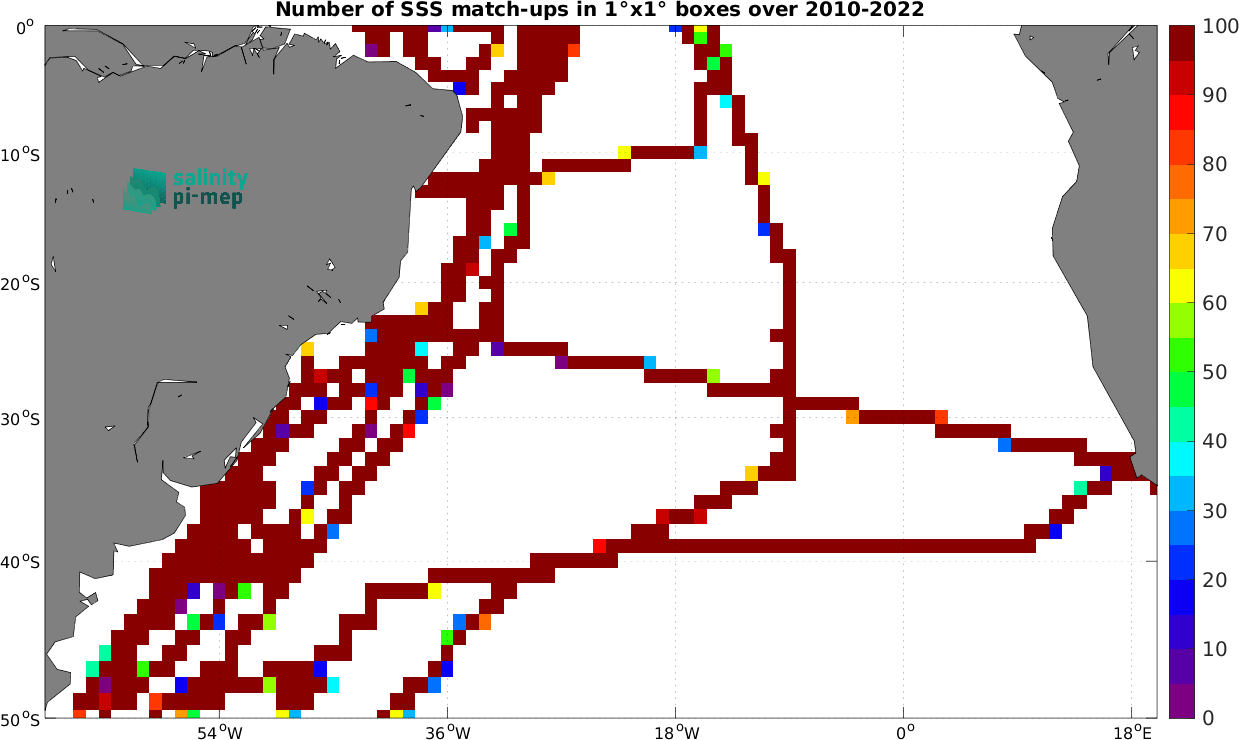
pimep-mdb-figure_SAO_smos-l3-catds-locean-v9-18d_tsg-csic-utm_Time-Number-SSS.png
05-Dec-2024 16:23
67K
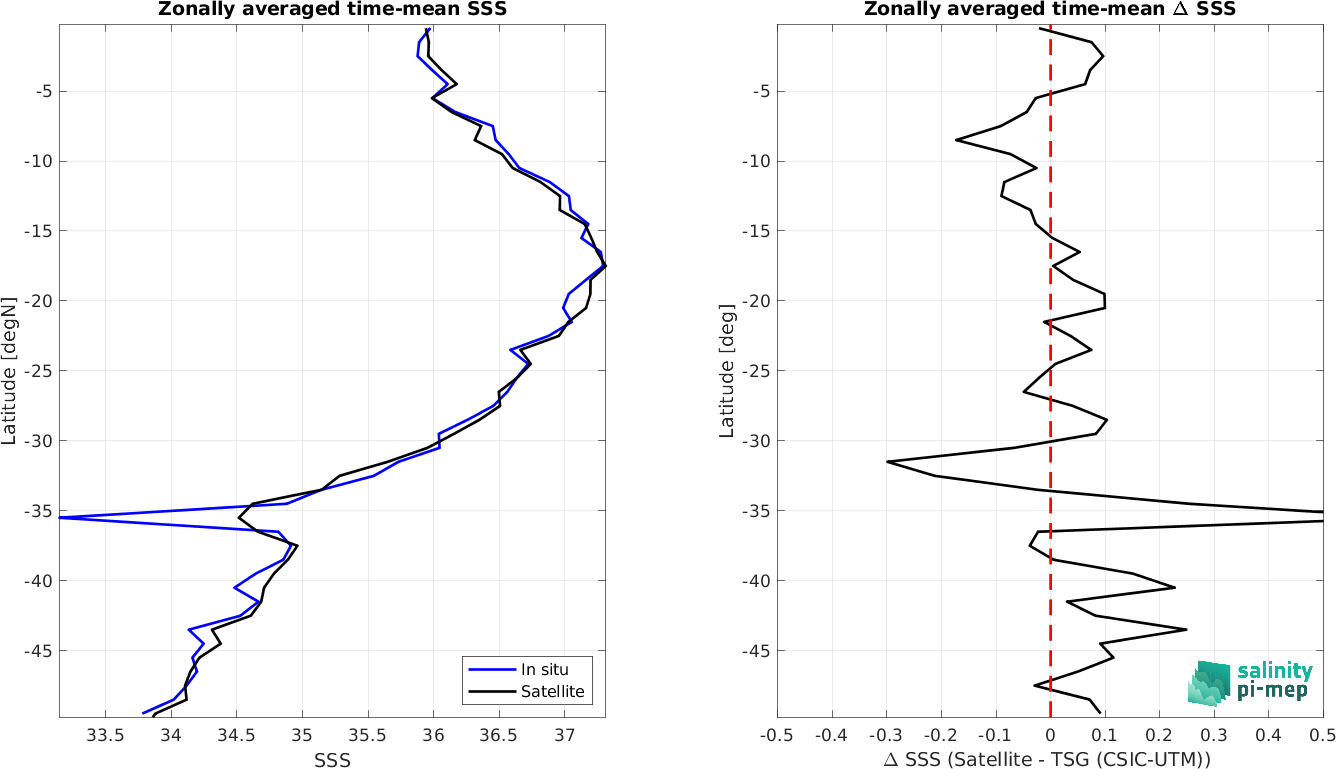
pimep-mdb-figure_SAO_smos-l3-catds-locean-v9-18d_tsg-csic-utm_Zonally-averaged-time-mean-SSS.png
05-Dec-2024 16:23
79K
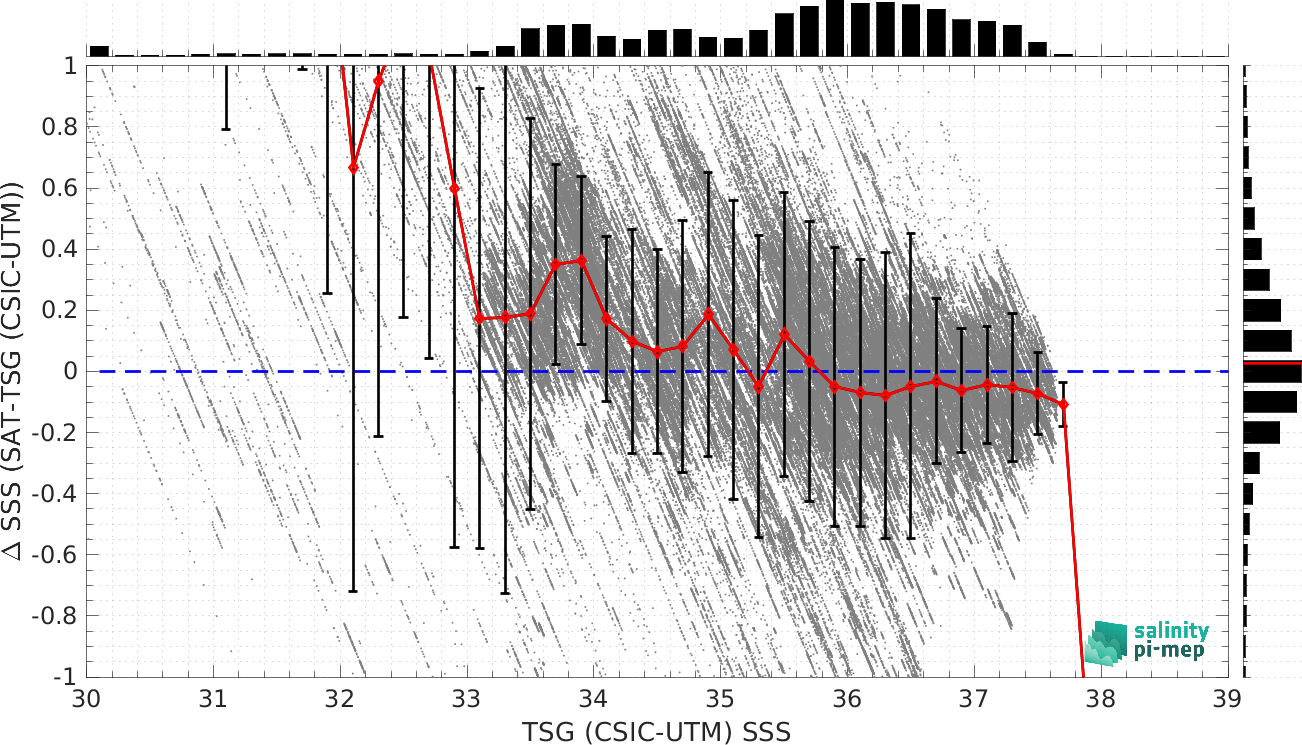
pimep-mdb-figure_SAO_smos-l3-catds-locean-v9-18d_tsg-csic-utm_DeltaSSS-vs-sss.png
05-Dec-2024 16:23
483K
pimep-mdb-figure_SAO_smos-l3-catds-locean-v9-18d_tsg-csic-utm_DeltaSSS-vs-sst.png
05-Dec-2024 16:23
576K
pimep-mdb-figure_SAO_smos-l3-catds-locean-v9-18d_tsg-csic-utm_DeltaSSS-vs-ws.png
05-Dec-2024 16:23
441K
pimep-mdb-figure_SAO_smos-l3-catds-locean-v9-18d_tsg-csic-utm_DeltaSSS-vs-RR.png
05-Dec-2024 16:23
257K
pimep-mdb-figure_SAO_smos-l3-catds-locean-v9-18d_tsg-csic-utm_DeltaSSS-vs-Dist2coast.png
05-Dec-2024 16:24
472K
pimep-mdb-figure_SAO_smos-l3-catds-locean-v9-18d_tsg-csic-utm_DeltaSSS-vs-Depth.png
05-Dec-2024 16:24
70K
pimep-mdb-figure_SAO_smos-l3-catds-locean-v9-18d_tsg-csic-utm_DeltaSSS-vs-SIC.png
05-Dec-2024 16:24
25K
pimep-mdb-figure_SAO_smos-l3-catds-locean-v9-18d_tsg-csic-utm_DeltaSSS-vs-Dist2iceedge.png
05-Dec-2024 16:24
342K
pimep-mdb-figure_SAO_smos-l3-catds-locean-v9-18d_tsg-csic-utm_DeltaSSS-vs-sssISAS.png
05-Dec-2024 16:24
220K
pimep-mdb-figure_SAO_smos-l3-catds-locean-v9-18d_tsg-csic-utm_DeltaSSS-vs-sstCMC.png
05-Dec-2024 16:24
516K
pimep-mdb-figure_SAO_smos-l3-catds-locean-v9-18d_tsg-csic-utm_DeltaSSS-vs-sstERA5.png
05-Dec-2024 16:24
484K
pimep-mdb-figure_SAO_smos-l3-catds-locean-v9-18d_tsg-csic-utm_DeltaSSS-vs-sstAVHRR.png
05-Dec-2024 16:24
499K
pimep-mdb-figure_SAO_smos-l3-catds-locean-v9-18d_tsg-csic-utm_DeltaSSS-vs-wsCCMP.png
05-Dec-2024 16:24
494K
pimep-mdb-figure_SAO_smos-l3-catds-locean-v9-18d_tsg-csic-utm_DeltaSSS-vs-RR-IMERG.png
05-Dec-2024 16:24
217K
pimep-mdb-figure_SAO_smos-l3-catds-locean-v9-18d_tsg-csic-utm_Scatterplot-SSSdensity.png
05-Dec-2024 16:24
69K
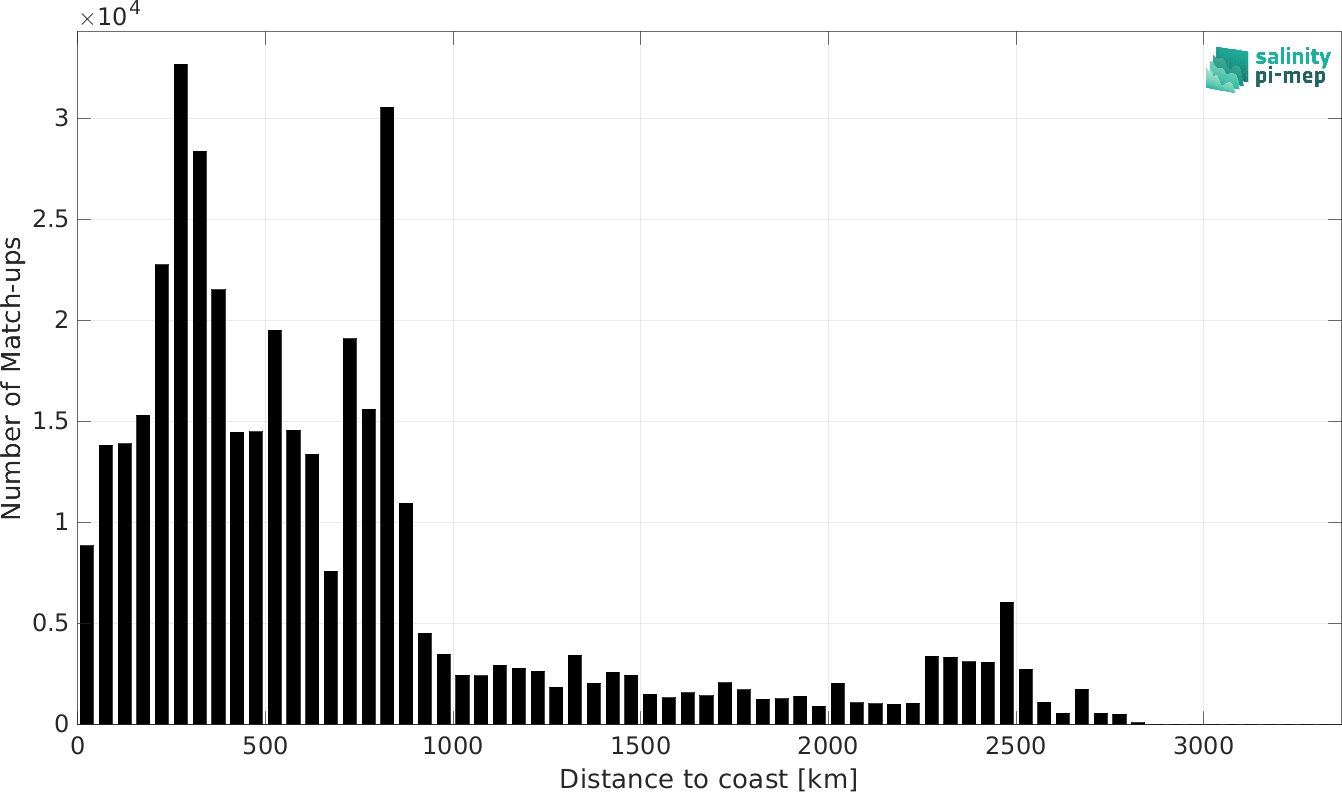
pimep-mdb-figure_SAO_smos-l3-catds-locean-v9-18d_tsg-csic-utm_Number-of-SSS-vs-dist2coast.png
05-Dec-2024 16:24
30K
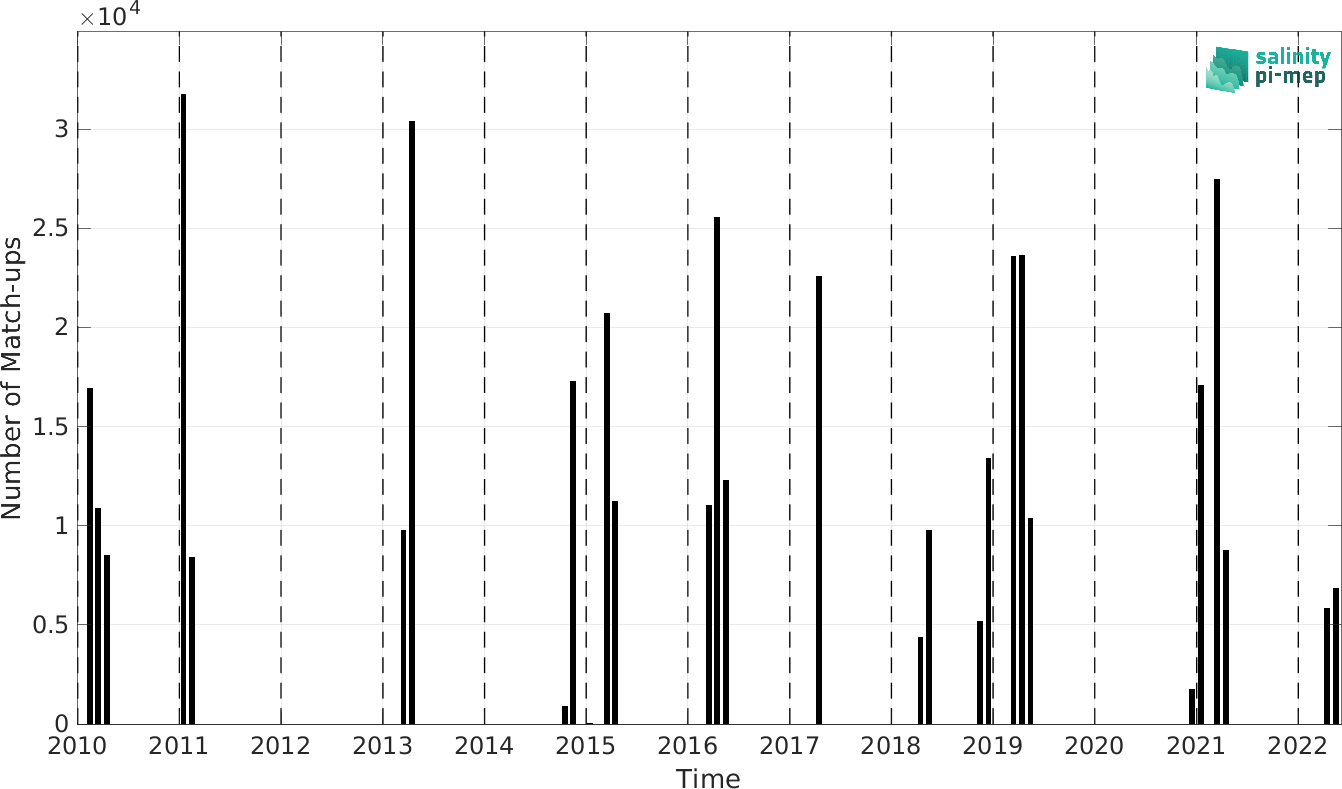
pimep-mdb-figure_SAO_smos-l3-catds-locean-v9-18d_tsg-csic-utm_Number-of-SSS-vs-time.png
05-Dec-2024 16:24
40K
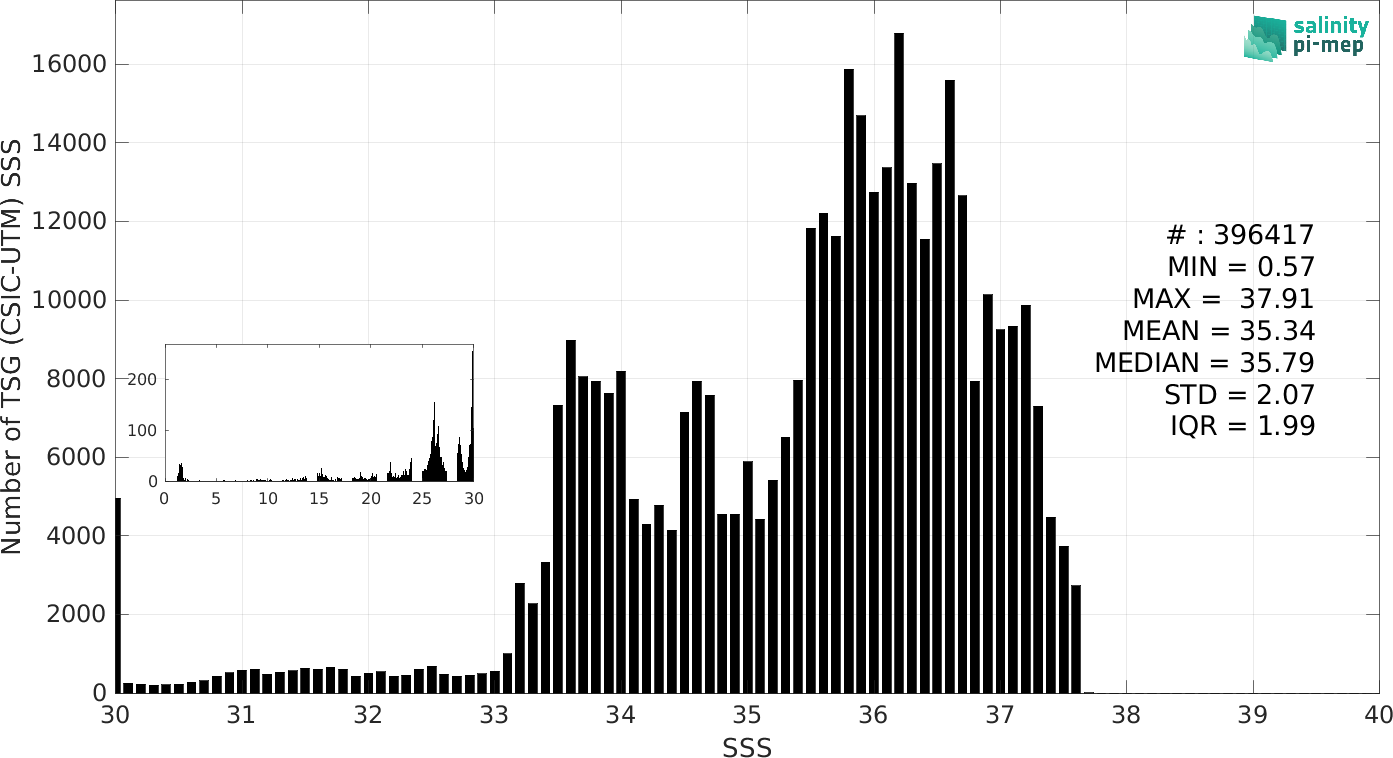
pimep-mdb-figure_SAO_smos-l3-catds-locean-v9-18d_tsg-csic-utm_SSS-INSITU-distribution.png
05-Dec-2024 16:24
58K
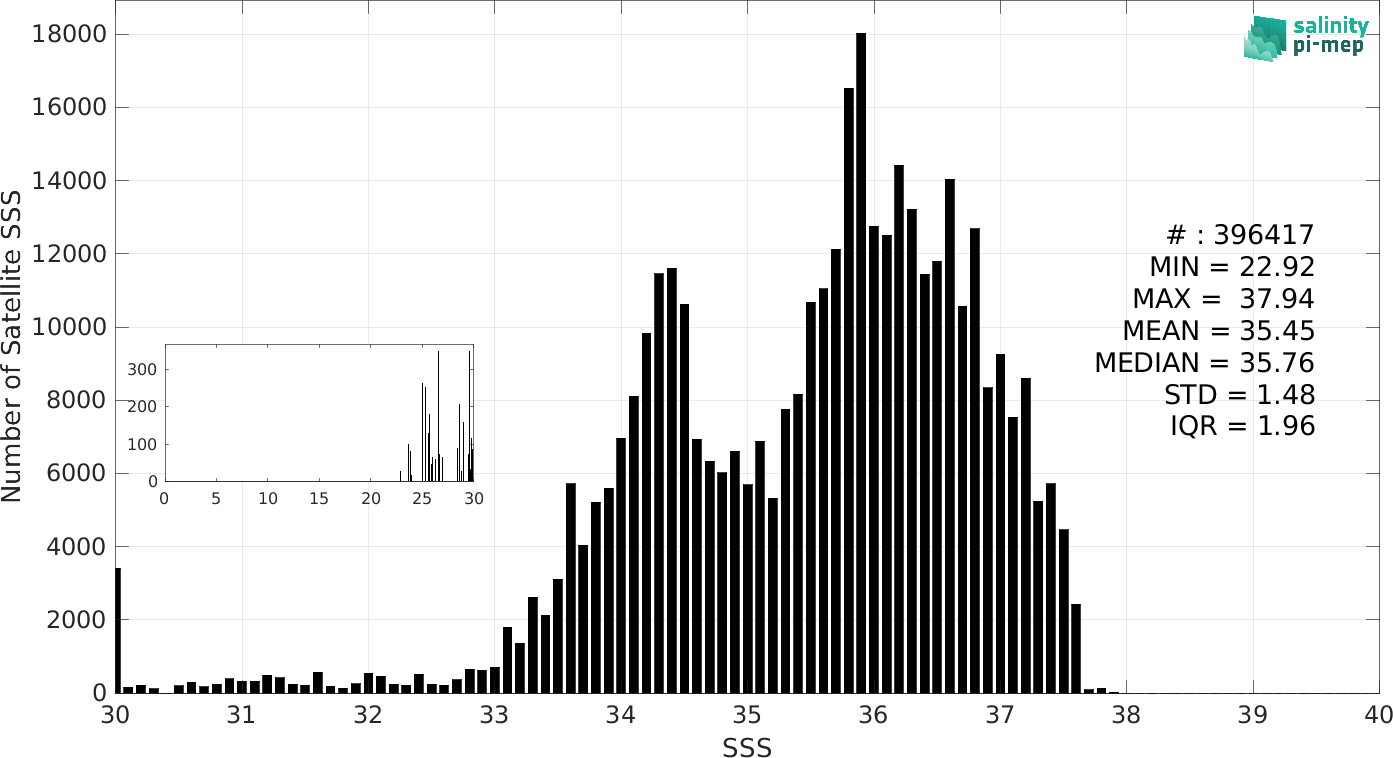
pimep-mdb-figure_SAO_smos-l3-catds-locean-v9-18d_tsg-csic-utm_SSS-SAT-distribution.png
05-Dec-2024 16:24
58K
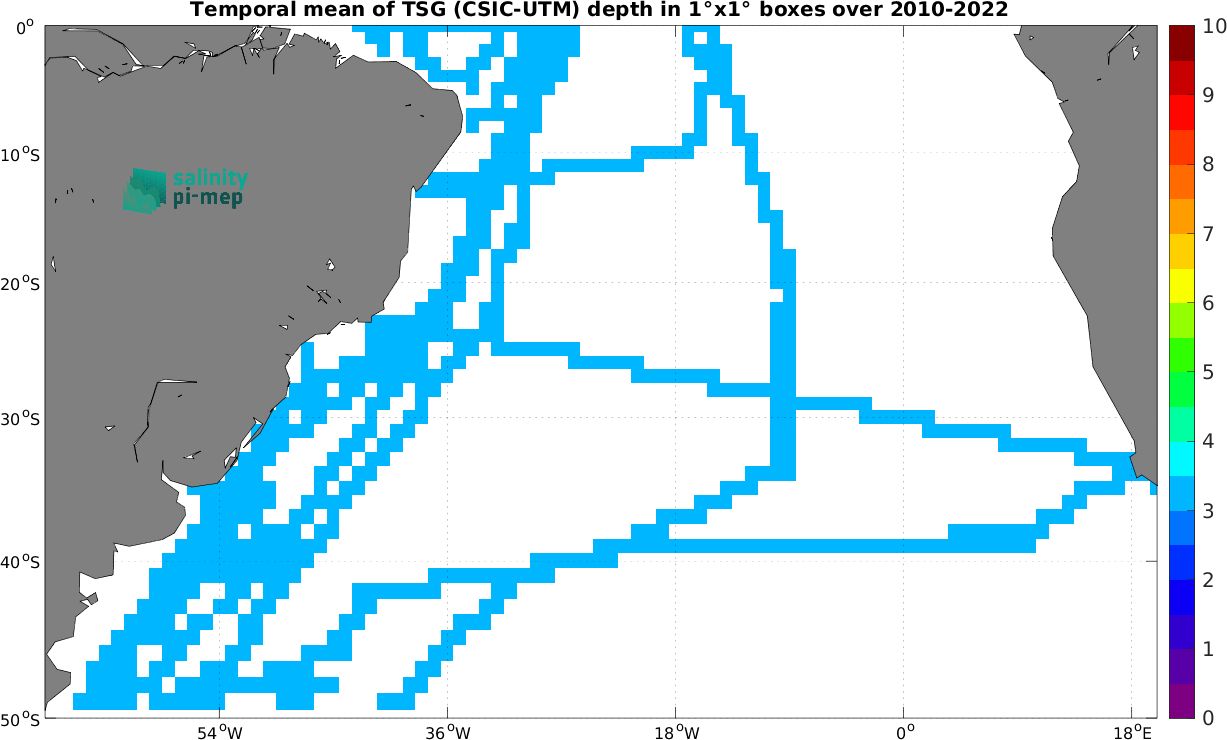
pimep-mdb-figure_SAO_smos-l3-catds-locean-v9-18d_tsg-csic-utm_Time-Mean-PRES.png
05-Dec-2024 16:24
64K
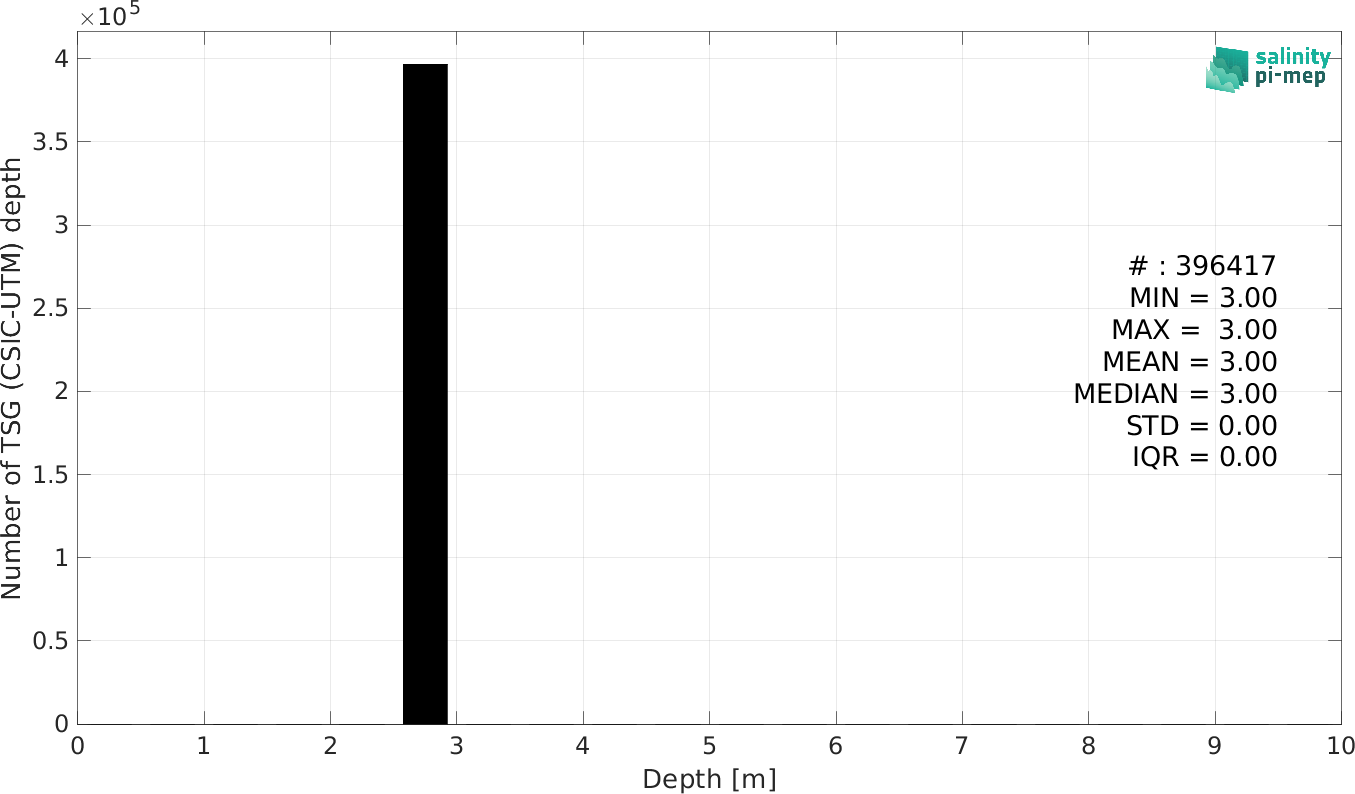
pimep-mdb-figure_SAO_smos-l3-catds-locean-v9-18d_tsg-csic-utm_PRES-distribution.png
05-Dec-2024 16:24
50K
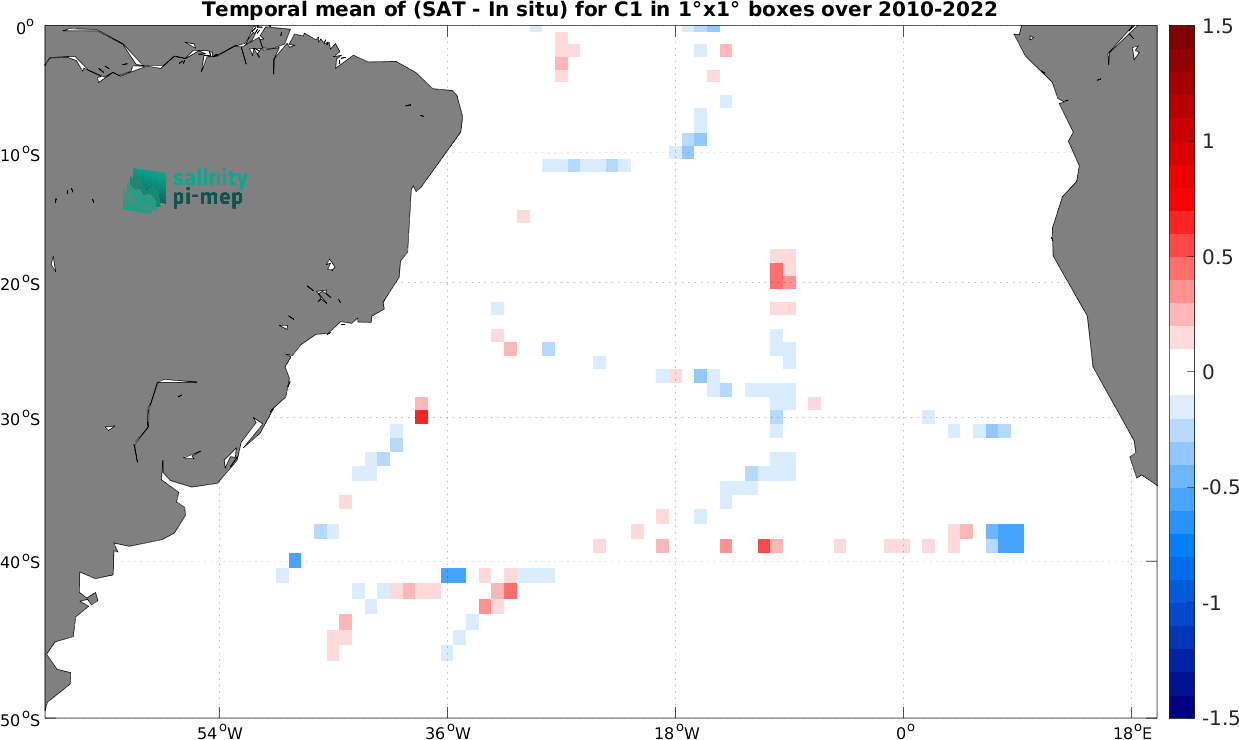
pimep-mdb-figure_SAO_smos-l3-catds-locean-v9-18d_tsg-csic-utm_Time-Mean-SSS-SAT-minus-INSITU-C1.png
05-Dec-2024 16:24
63K
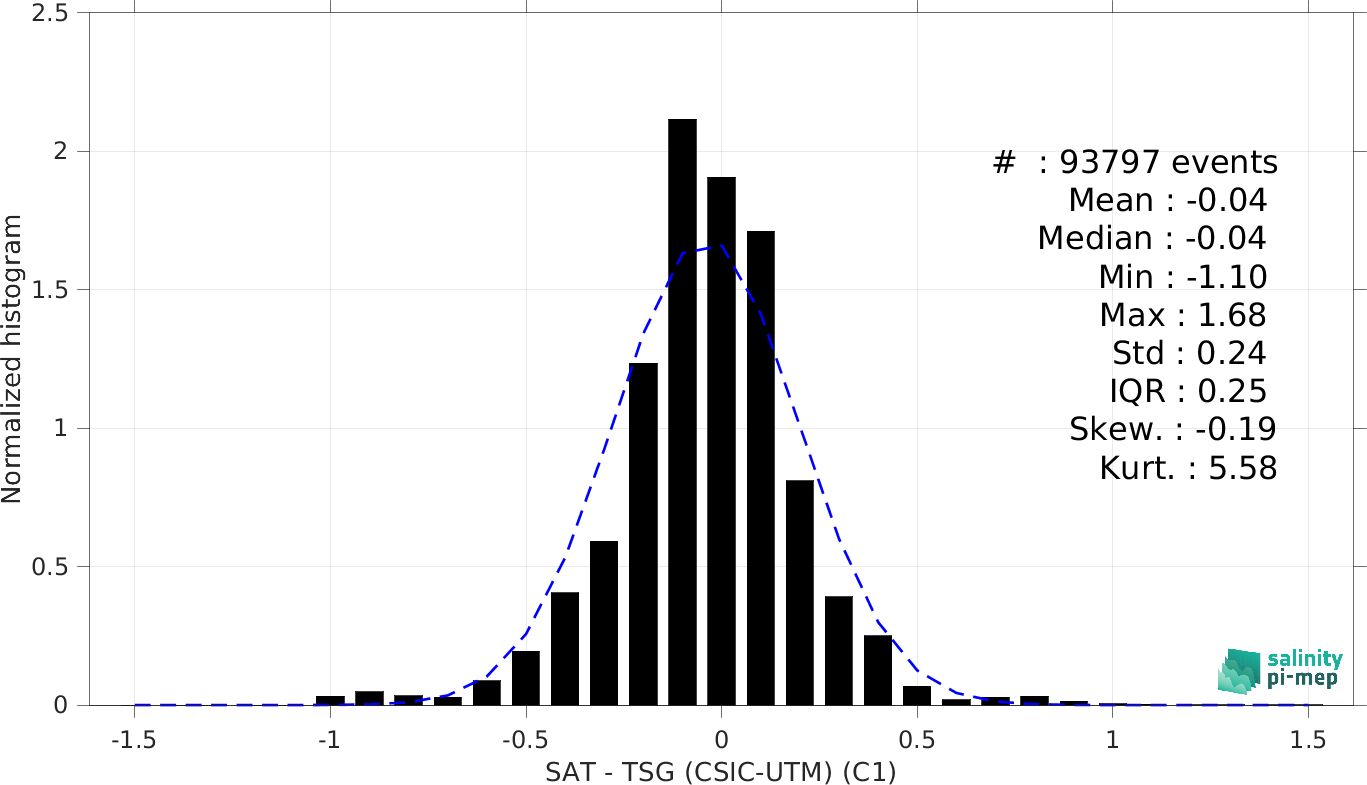
pimep-mdb-figure_SAO_smos-l3-catds-locean-v9-18d_tsg-csic-utm_Histogram-SSS-SAT-minus-INSITU-C1.png
05-Dec-2024 16:24
66K
pimep-mdb-figure_SAO_smos-l3-catds-locean-v9-18d_tsg-csic-utm_Time-Mean-SSS-SAT-minus-INSITU-C2.png
05-Dec-2024 16:24
65K
pimep-mdb-figure_SAO_smos-l3-catds-locean-v9-18d_tsg-csic-utm_Histogram-SSS-SAT-minus-INSITU-C2.png
05-Dec-2024 16:24
72K
pimep-mdb-figure_SAO_smos-l3-catds-locean-v9-18d_tsg-csic-utm_Histogram-SSS-SAT-minus-INSITU-C3.png
05-Dec-2024 16:24
73K
pimep-mdb-figure_SAO_smos-l3-catds-locean-v9-18d_tsg-csic-utm_Time-Mean-SSS-SAT-minus-INSITU-C3.png
05-Dec-2024 16:24
62K
pimep-mdb-figure_SAO_smos-l3-catds-locean-v9-18d_tsg-csic-utm_Time-Mean-SSS-SAT-minus-INSITU-C5.png
05-Dec-2024 16:24
65K
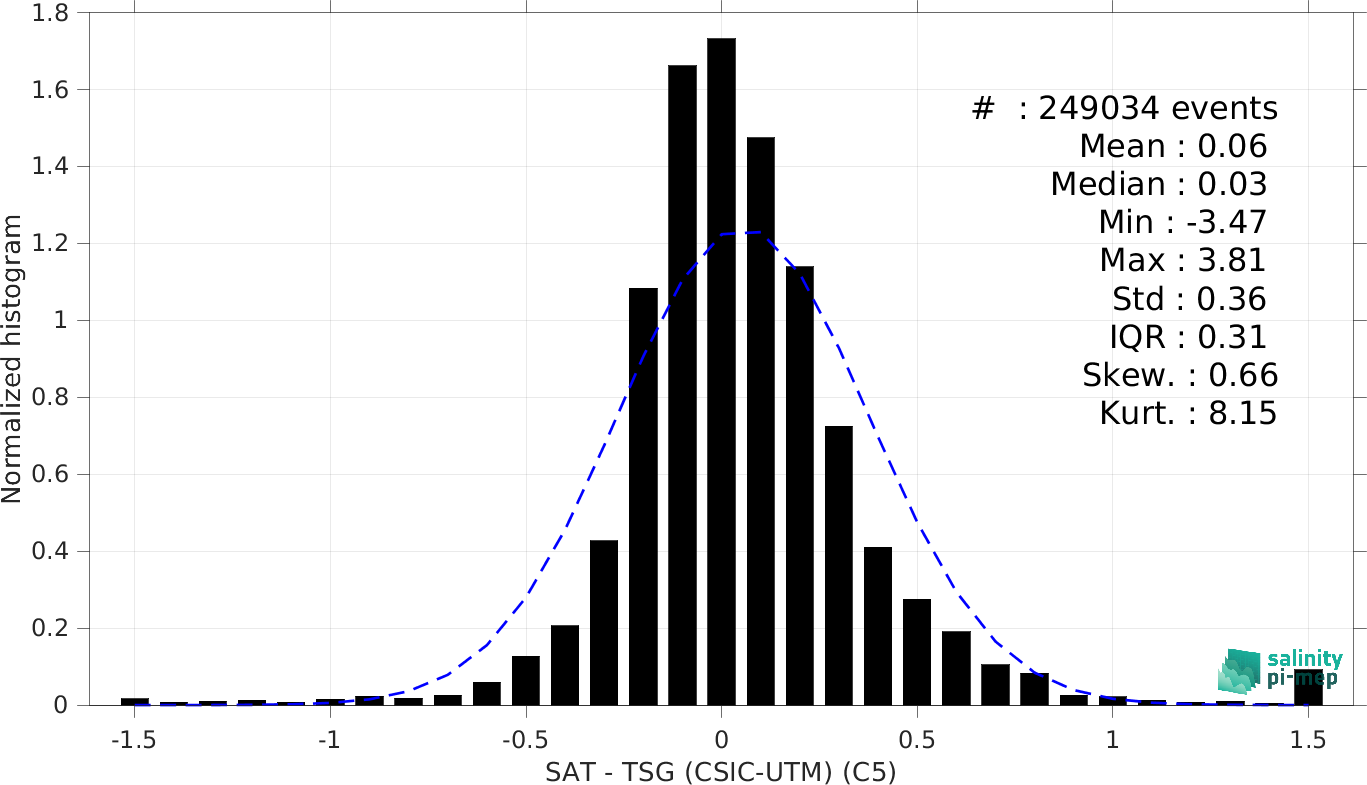
pimep-mdb-figure_SAO_smos-l3-catds-locean-v9-18d_tsg-csic-utm_Histogram-SSS-SAT-minus-INSITU-C5.png
05-Dec-2024 16:24
73K
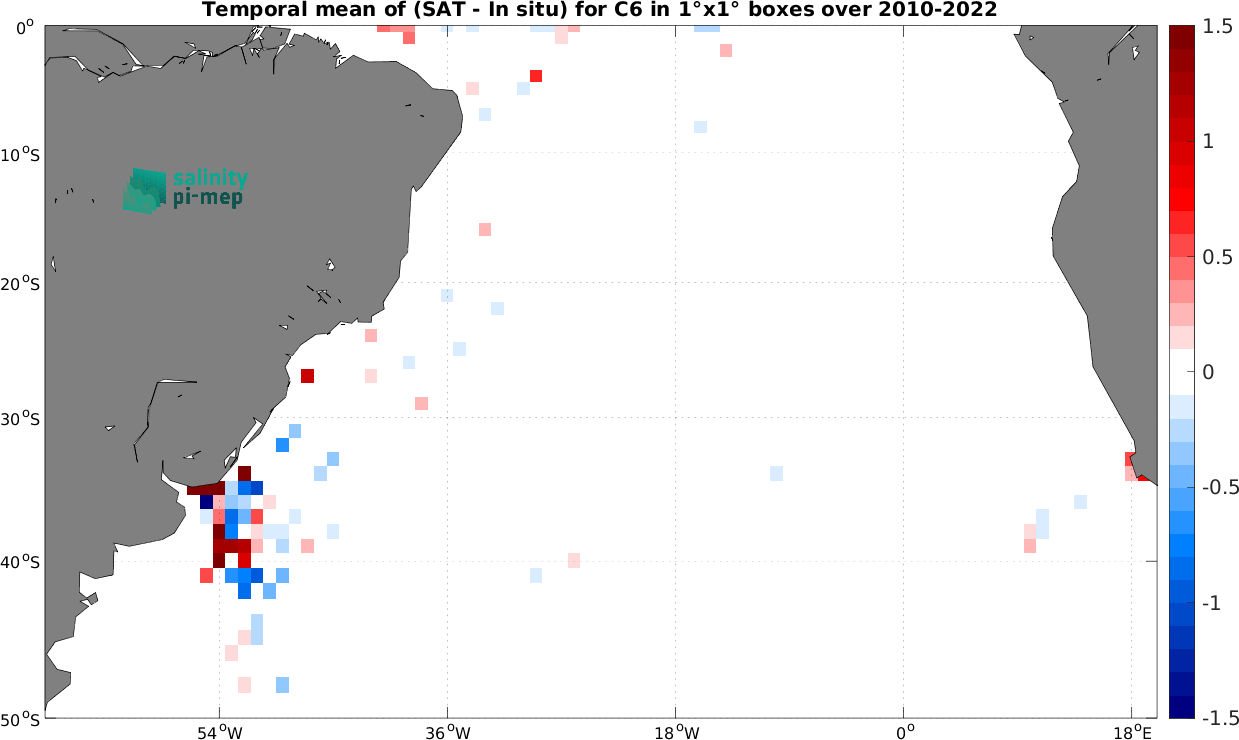
pimep-mdb-figure_SAO_smos-l3-catds-locean-v9-18d_tsg-csic-utm_Time-Mean-SSS-SAT-minus-INSITU-C6.png
05-Dec-2024 16:24
63K
pimep-mdb-figure_SAO_smos-l3-catds-locean-v9-18d_tsg-csic-utm_Histogram-SSS-SAT-minus-INSITU-C6.png
05-Dec-2024 16:24
70K
pimep-mdb-figure_SAO_smos-l3-catds-locean-v9-18d_tsg-csic-utm_Scatterplot-SSSdiff-vs-Time.png
05-Dec-2024 16:24
151K
pimep-mdb-figure_SAO_smos-l3-catds-locean-v9-18d_tsg-csic-utm_Scatterplot-SSSdiff-vs-Time-C1.png
05-Dec-2024 16:24
140K
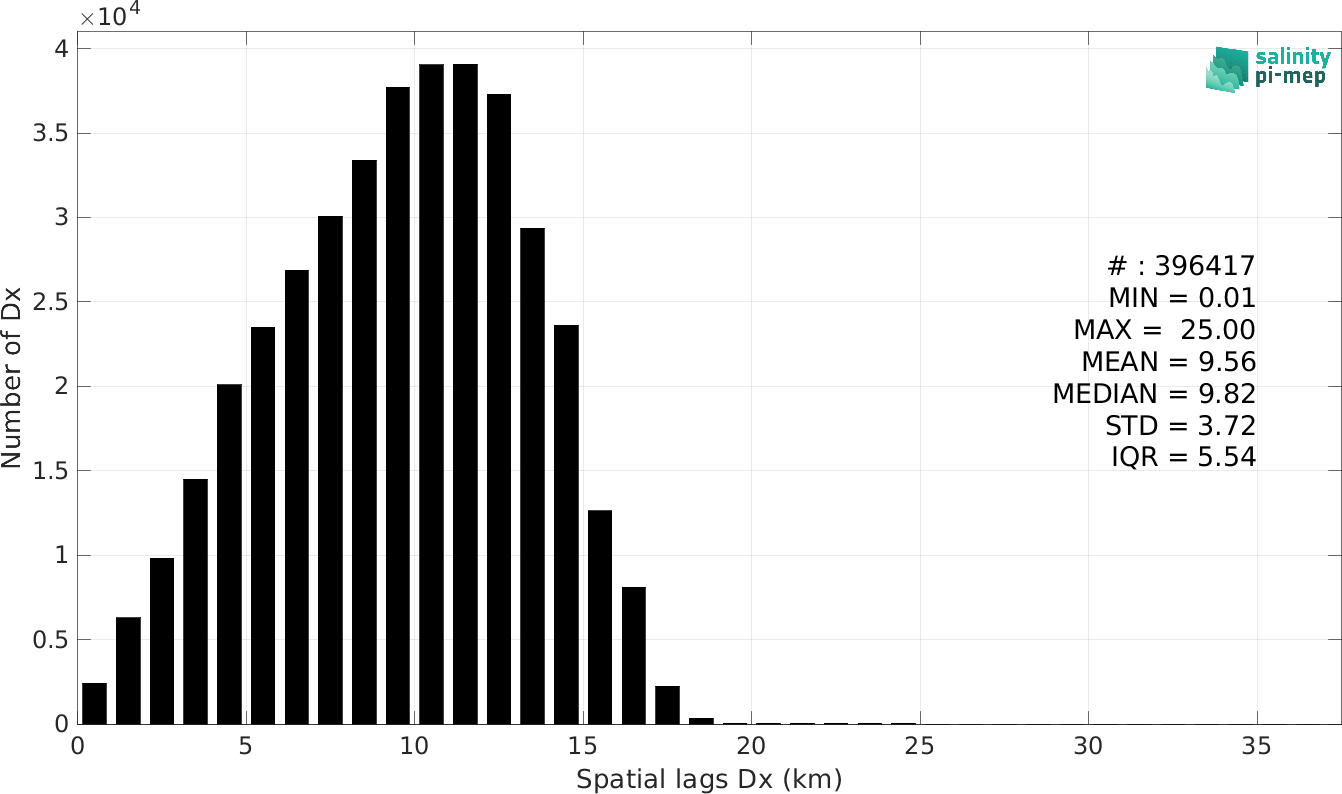
pimep-mdb-figure_SAO_smos-l3-catds-locean-v9-18d_tsg-csic-utm_Dx-distribution.png
05-Dec-2024 16:24
48K
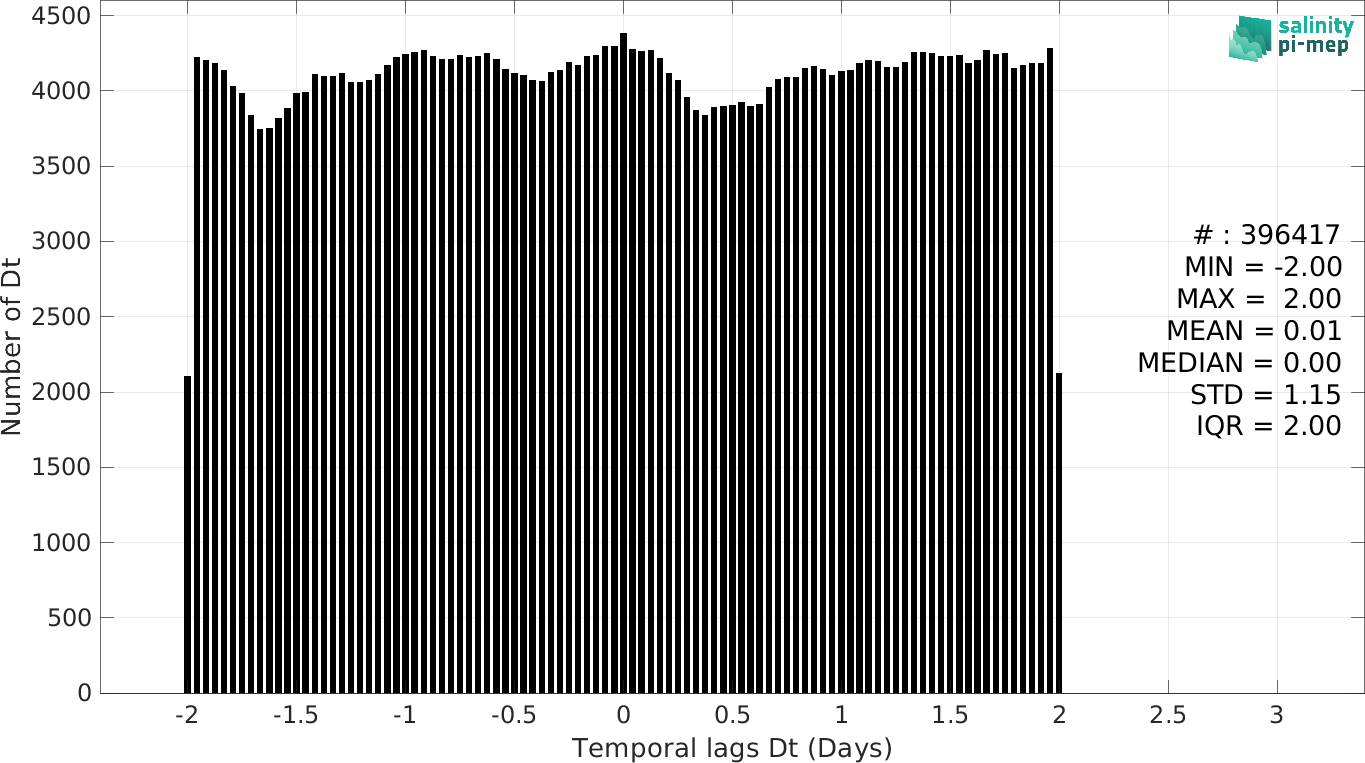
pimep-mdb-figure_SAO_smos-l3-catds-locean-v9-18d_tsg-csic-utm_Dt-distribution.png
05-Dec-2024 16:24
49K
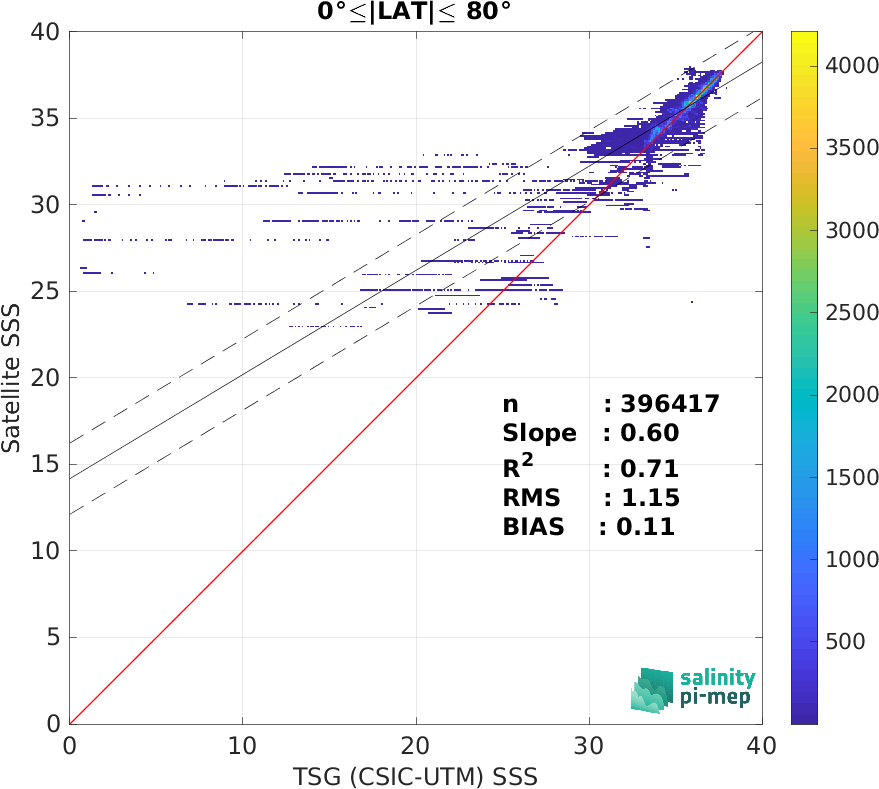
pimep-mdb-figure_SAO_smos-l3-catds-locean-v9-18d_tsg-csic-utm_Scatterplot-SSSdensity-Latband-0-80.png
05-Dec-2024 16:24
71K
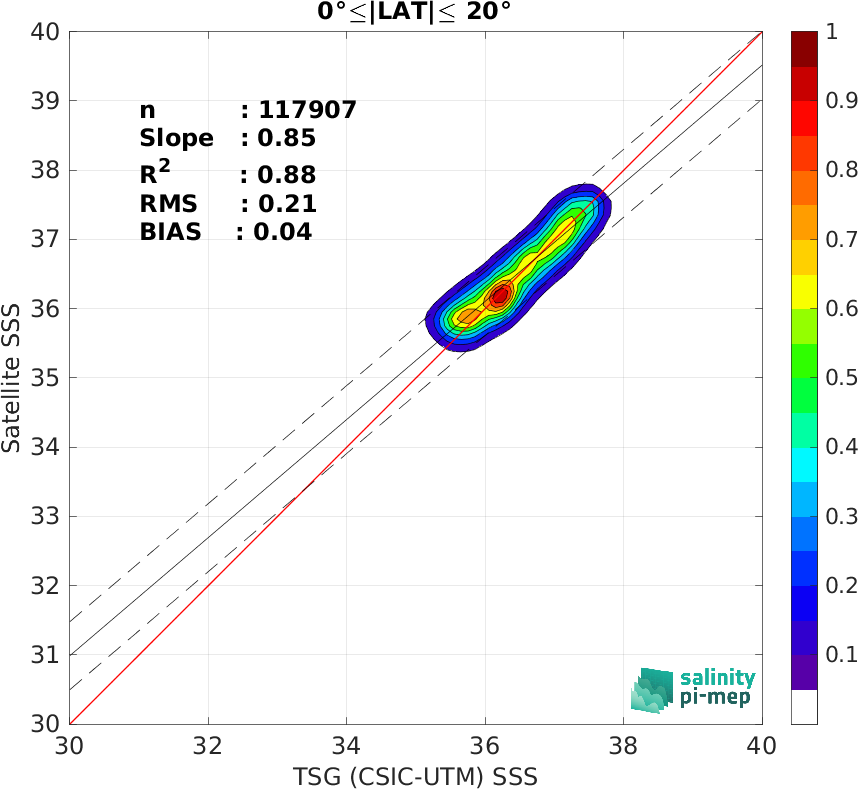
pimep-mdb-figure_SAO_smos-l3-catds-locean-v9-18d_tsg-csic-utm_Scatterplot-SSSdensity-Latband-0-20.png
05-Dec-2024 16:24
89K
pimep-mdb-figure_SAO_smos-l3-catds-locean-v9-18d_tsg-csic-utm_Scatterplot-SSSdensity-Latband-20-40.png
05-Dec-2024 16:24
68K
pimep-mdb-figure_SAO_smos-l3-catds-locean-v9-18d_tsg-csic-utm_Scatterplot-SSSdensity-Latband-40-60.png
05-Dec-2024 16:24
82K
pimep-mdb-figure_SAO_smos-l3-catds-locean-v9-18d_tsg-csic-utm_Scatterplot-SSSdiff-vs-Time-Latband-0-80.png
05-Dec-2024 16:24
94K
pimep-mdb-figure_SAO_smos-l3-catds-locean-v9-18d_tsg-csic-utm_Scatterplot-SSSdiff-vs-Time-Latband-0-20.png
05-Dec-2024 16:24
83K
pimep-mdb-figure_SAO_smos-l3-catds-locean-v9-18d_tsg-csic-utm_Scatterplot-SSSdiff-vs-Time-Latband-20-40.png
05-Dec-2024 16:24
91K
pimep-mdb-figure_SAO_smos-l3-catds-locean-v9-18d_tsg-csic-utm_Scatterplot-SSSdiff-vs-Time-Latband-40-60.png
05-Dec-2024 16:25
78K